Maps help make Qualified Opportunity Zones (QOZ) easier to understand. If you read our previous blog post, you know that we know the state, county/parish and census tract code of each QOZ. What we don’t know is: where are those “tracts?”
Each county/parish can have dozens of tracts, so we have to find another trove of data to link to the tract code. For that, we turn to the U.S. Census Bureau’s TigerWeb.
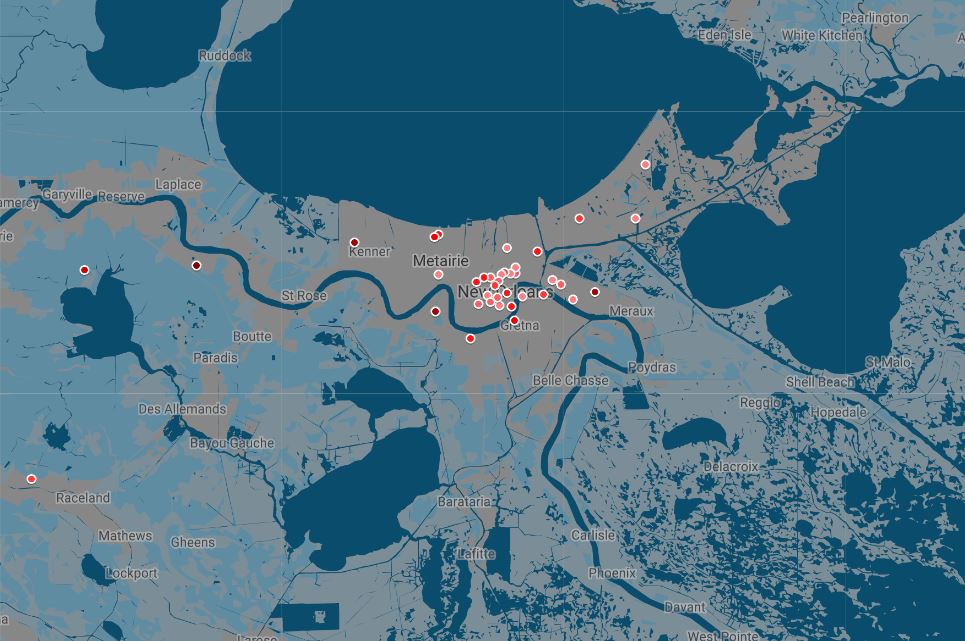
What we’re looking for is Census tracts with a correlating coordinates. What we found was this (for Louisiana, specifically):
https://tigerweb.geo.census.gov/tigerwebmain/Files/acs19/tigerweb_acs19_tract_la.html
For reasons that are not entirely clear, it’s only provided in an HTML table format. Thankfully, this table format almost as old as the Internet itself, so it’s easily “scraped” into Excel using a free Chrome plugin, Table Capture.

On the plus side, this table include a “GEOID” field that, after testing, appears to be the full 11-digit code–no need for the complicated concatenation formulas from earlier. Now we can link all the data from the Census to QOZs, and know the approximate coordinates of each tract.
